Part 1 Recap
This tutorial is part of a multi-part series: in Part 1, we loaded our data from a .csv file and used Linear Regression in order to predict the number of patients that the hospital is expected to receive in future years.
Introduction
In this second part, we will focus our work on the UI and the Data Visualization. We will build a 3D histogram and the relative UI in order to manage the data visualization process.
Tutorial Source Code
All of the Part 2 source code can be downloaded here.
Improve our UI
In order to have a cleaner user experience, we will use two scenes:
- A scene with the menu, where the user can predict the affluence of patients in the next years, simply using an input field and the ability to read the data from the .csv
- A scene where we will show the data visualization, where the user will have the possibility to look at a 3D histogram of the data and the prediction. Furthermore, we will allow the user to customize the data visualization, increasing and decreasing the size of the histogram.
First, we create a new button inside the canvas called “GoToGraphScene”, later we will reorganize the UI, this button will allow the user to navigate through the scenes.
Here we create a new script called NavigateScenes.cs in the Scripts folder, where we load the new scene and allow the user to change the scene.
using System.Collections;
using System.Collections.Generic;
using UnityEngine;
using UnityEngine.SceneManagement;

public class NavigateScenes : MonoBehaviour {

    public void LoadScene()
    {
        Scene scene = SceneManager.GetActiveScene();
        SceneManager.LoadScene("tutorial_graph");

    }
}
Note that I included “using UnityEngine.SceneManagement”.
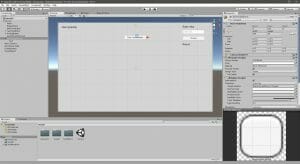
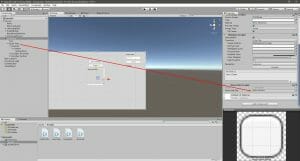
We need to execute the script when the “GoToMenu” button is clicked by the user, in order to do that :
- Add the script to the “GoToMenu” button
- Click on the plus sign on the On Click section
- Drag the button itself on the empty field
- Select from the dropdown menu in the On Click section the NavigateScenes, then LoadScene function.
We create a new scene called “tutorial_graph” in the asset folder.
Save the changes in the “tutorial” scene and now let’s repeat the same process for the navigation button in the “tutorial_graph” scene:
- Create a canvas
- Create a panel inside the canvas
- Create a button called “GoToMenu” inside the canvas,
in order to go back to the menu - Anchor the button on the top and centre of the canvas
- Assign the script called “NavigateScene.cs” to the button
- Execute the script when the button is clicked
- Save changes
We can optimize this process, instead of creating a new script for each scene, we can add some line of codes in the”NavigateScene.cs” script and load the different scenes based on which is the active scene at the moment, you can find more details about this topic in the SceneManager docs https://docs.unity3d.com/ScriptReference/SceneManagement.SceneManager.html. We use an if because we have only two scenes, with more scene would be better a switch statement or a more complex architecture, but for now, if we are in “tutorial” we will go to “tutorial_graph” or the inverse operation, so a simple if it’s enough.
using System.Collections;
using System.Collections.Generic;
using UnityEngine;
using UnityEngine.SceneManagement;

public class NavigateScenes : MonoBehaviour {

    public void LoadScene()
    {
        Scene scene = SceneManager.GetActiveScene();
        if (scene.name != "tutorial")
        {
            SceneManager.LoadScene("tutorial");
        }
        else
        {
            SceneManager.LoadScene("tutorial_graph");
        }
    }
}
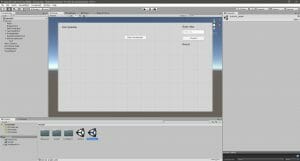
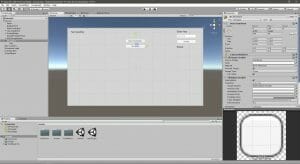
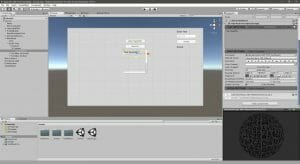
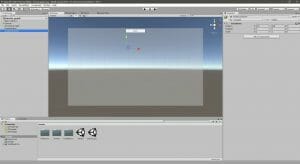
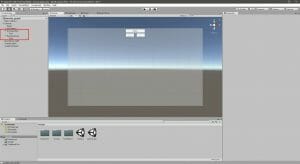
This is the look of the new scene, feels empty, but we will add awesome things later in the tutorial.
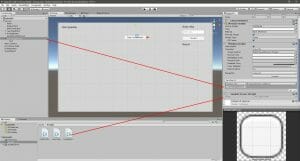
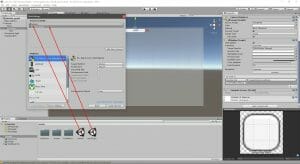
Open the build settings from the File menu, we need to add in the build window both the scenes, we can do it simply dragging them into this window, after that our build settings window should look like this:
Now, clicking on the button should change the scene in both of the scenes, so the user can now navigate successfully from the menu to the data visualization scene and back.
Let’s go back to the first “tutorial” scene to improve the UI.
Would be great to fold the dataset text with a button, so we create a new button called “ShowData”, remember to create this element inside the canvas.
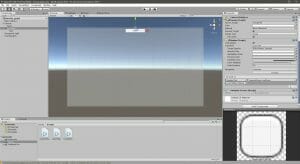
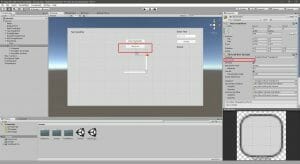
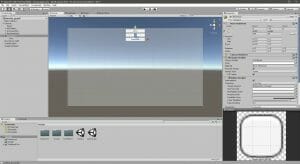
Inside that button, we create a Scroll View from the UI menu, the scroll view object allows the user to scroll through a long list of data. I disabled the horizontal scroll, anchor the scroll view at the bottom of the button, as you can see in the screenshot.
Set the value of the Scrollbar Vertical Scrollbar script to 1, so the scrollbar starts from the top, it is important to set this value, otherwise, the text will start in the middle of the scroll view.
Now we drag the DatasetText object inside the Content object of the scroll view, remember to anchor this element (I used the top left anchor), so even in with different screen sizes the position will be relatively the same.
A long list can be tedious to watch, so it is better to make the user choose to expand it or not. In order to add the show or hide functionality of our “ShowData” button, we create a script called “ShowHide.cs” in the Scripts folder.
using System.Collections;
using System.Collections.Generic;
using UnityEngine;

public class ShowHide : MonoBehaviour
{

    public GameObject showHideObj;

    public void ShowHideTask()
    {
        if (showHideObj.activeSelf)
        {
            showHideObj.SetActive(false);

        }
        else
        {
            showHideObj.SetActive(true);
        }
    }

}
As you can see in the code, using an If we check if the object is active or not, so we hide or show our Scroll View. Feel free to reuse this code to add more functionalities like this in other parts of the UI.
Add that script to the “ShowData” button and assign the ScrollView as the target object.
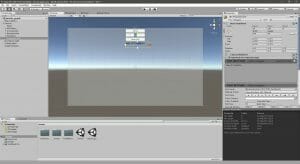
Next, we add the show/hide functionality on the click event, just dragging the button itself in the On Click() section, selecting the ShowHideTask() from the “ShowHide.cs” script.
Disable the Scroll View element.
Now, clicking on the button should hide or show the dataset list.
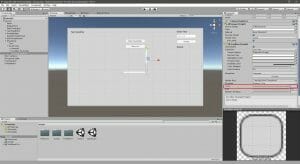
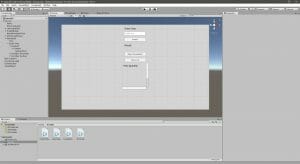
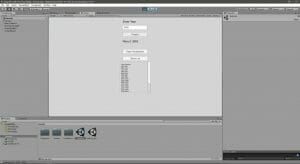
Let’s centre the UI elements like in this screenshot, all elements are anchored at the top center, this will make our application easier to use on smaller screens, such as small smartphone devices or low-resolution tablets.
Create the Data Visualization
We need to modify the code of LinearRegression.cs, we need to make our List static, this will allow us to pass values between scripts and scenes. In order to have more details about the static modifier, you can look at the docs (https://docs.microsoft.com/en-us/dotnet/csharp/language-reference/keywords/static).
Let’s add the static modifier to the lists variables and a clear function in order to avoid to load the same list multiple times.
using System;
using System.Collections;
using System.Collections.Generic;
using UnityEngine;
using UnityEngine.UI;
using TMPro;

public class LinearRegression : MonoBehaviour
{
    public TextMeshProUGUI textPredictionResult;
    public TextMeshProUGUI textDatasetObject;
    public InputField inputObject;

    // Use public and static to share the lists data
    public static List<double> yearValues = new List<double>();
    public static List<double> quantityValues = new List<double>();

    void Start()
    {
        // Clear the lists
        yearValues.Clear();
        quantityValues.Clear();

        TextAsset csvdata = Resources.Load<TextAsset>("dataset");

        string[] data = csvdata.text.Split(new char[] { '\n' });
        textDatasetObject.text = "Year Quantity";


        for (int i = 1; i < data.Length - 1; i++)
        {
            string[] row = data[i].Split(new char[] { ',' });

            if (row[1] != "")
            {
                DataInterface item = new DataInterface();

                int.TryParse(row[0], out item.year);
                int.TryParse(row[1], out item.quantity);

                yearValues.Add(item.year);
                quantityValues.Add(item.quantity);
                textDatasetObject.text += "\n" + item.year + " " + item.quantity;


            }
        }
    }

    public void PredictionTask()
    {

        double intercept, slope;
        LinearRegressionCalc(yearValues.ToArray(), quantityValues.ToArray(), out intercept, out slope);


        var predictedValue = (slope * int.Parse(inputObject.text)) + intercept;
        textPredictionResult.text = "Result: " + predictedValue;
        Debug.Log("Prediction for " + inputObject.text + " : " + predictedValue);

    }


    public static void LinearRegressionCalc(
        double[] xValues,
        double[] yValues,
        out double yIntercept,
        out double slope)
    {
        if (xValues.Length != yValues.Length)
        {
            throw new Exception("Input values should be with the same length.");
        }

        double xSum = 0;
        double ySum = 0;
        double xSumSquared = 0;
        double ySumSquared = 0;
        double codeviatesSum = 0;

        for (var i = 0; i < xValues.Length; i++)
        {
            var x = xValues[i];
            var y = yValues[i];
            codeviatesSum += x * y;
            xSum += x;
            ySum += y;
            xSumSquared += x * x;
            ySumSquared += y * y;
        }

        var count = xValues.Length;
        var xSS = xSumSquared - ((xSum * xSum) / count);
        var ySS = ySumSquared - ((ySum * ySum) / count);

        var numeratorR = (count * codeviatesSum) - (xSum * ySum);
        var denomR = (count * xSumSquared - (xSum * xSum)) * (count * ySumSquared - (ySum * ySum));
        var coS = codeviatesSum - ((xSum * ySum) / count);

        var xMean = xSum / count;
        var yMean = ySum / count;

        yIntercept = yMean - ((coS / xSS) * xMean);
        slope = coS / xSS;
    }

}
Let’s open the “tutorial_graph” scene and create an empty GameObject called “GraphContainer”, this object will contain all the bars of the graph.
Now, we will create dynamically the data visualization, in order to do that we create a new script called “GenDataViz.cs”, this is the code:
using System.Collections;
using System.Collections.Generic;
using UnityEngine;
using UnityEngine.UI; // Required when Using UI elements.

public class GenDataViz : MonoBehaviour {
    int scaleSize = 100;
    int scaleSizeFactor = 10;
    public GameObject graphContainer;
    int binDistance = 13;
    float offset = 0;

    // Use this for initialization
    void Start () {
        CreateGraph();
    }


    public void ClearChilds(Transform parent)
    {
        offset = 0;
        foreach (Transform child in parent)
        {
            Destroy(child.gameObject);
        }
    }


    public void CreateGraph()
    {
        Debug.Log("creating the graph");
        ClearChilds(graphContainer.transform);
        for (var i = 0; i < LinearRegression.quantityValues.Count; i++)
        {
            createBin(10, (float)LinearRegression.quantityValues[i] / scaleSize, 10, offset, ((float)LinearRegression.quantityValues[i] / scaleSize) / 2, graphContainer);
            offset += binDistance;
        }

    }


    void createBin(float Scale_x, float Scale_y, float Scale_z, float Padding_x, float Padding_y, GameObject _parent)
    {
        GameObject cube = GameObject.CreatePrimitive(PrimitiveType.Cube);
        cube.transform.SetParent(_parent.transform, true);
        cube.transform.position = new Vector3(Padding_x, Padding_y - 100, 400);

        Vector3 scale = new Vector3(Scale_x, Scale_y, Scale_z);

        cube.transform.localScale = scale;
    }

    // Update is called once per frame
    void Update () {

	}
}
The code logic works in this order:
- Clear previous graphs if they are present.
- Load the data from the script “LinearRegression.cs” and using a for loop we pass the data inside the “createBar” function.
- Set a parent container.
- The “createBar” function creates a primitive cube inside the parent container, so if we want to clear the graph we simply remove the children of the parent container. The cube has a fixed width, its height is taken from the number of patients in a particular year. We use the scaleHeight in order to modify the size of the height of the visualization, offset helps us to have a distance between the bars.
- There a scaleSize value that we will use later to allow the user to customize the graph.
- There is an offset value that allows us to create a bin next to the other.
This part of the code:
((float)LinearRegression.quantityValues[i] / scaleSize) / 2
assures that each bar of the histogram will start from the same baseline, otherwise, the bars will be centred vertically.
This line:
cube.transform.position = new Vector3(Padding_x, Padding_y - 100, 400);
contains fixed values in order to position the histogram in front of the camera, feel free to change this values (100 is y, 400 is z) in order to position the histogram where you like. In the third part of the tutorial, we will use a target image and the histogram will spawn on the target, so those coordinates will be removed.
We need to assign the “GenDataViz.cs” to the GraphContainer object, in the graphContainer field of the script we drag the GraphContainer object.
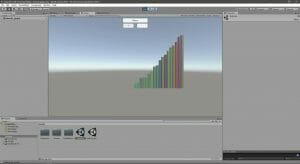
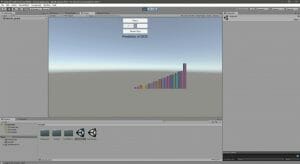
Now, everything should be fine, let’s start the game scene from the “tutorial” scene and navigate to the “graph_tutorial” scene using the go-to button, the 3D histogram should appear near the centre of the screen.
The histogram looks really boring and it’s hard to distinguish one bar from another, let’s add some colors, in this snippet of code we add a random color to each bar.
using System.Collections;
using System.Collections.Generic;
using UnityEngine;
using UnityEngine.UI; // Required when Using UI elements.

public class GenDataViz : MonoBehaviour
{
    int scaleSize = 100;
    int scaleSizeFactor = 10;
    public GameObject graphContainer;
    int binDistance = 13;
    float offset = 0;

    // Use this for initialization
    void Start()
    {
        CreateGraph();
    }


    public void ClearChilds(Transform parent)
    {
        offset = 0;
        foreach (Transform child in parent)
        {
            Destroy(child.gameObject);
        }
    }


    public void CreateGraph()
    {
        Debug.Log("creating the graph");
        ClearChilds(graphContainer.transform);
        for (var i = 0; i < LinearRegression.quantityValues.Count; i++)
        {
            createBin(10, (float)LinearRegression.quantityValues[i] / scaleSize, 10, offset, ((float)LinearRegression.quantityValues[i] / scaleSize) / 2, graphContainer);
            offset += binDistance;
        }

    }


    void createBin(float Scale_x, float Scale_y, float Scale_z, float Padding_x, float Padding_y, GameObject _parent)
    {
        GameObject cube = GameObject.CreatePrimitive(PrimitiveType.Cube);
        cube.transform.SetParent(_parent.transform, true);

        cube.transform.position = new Vector3(Padding_x, Padding_y - 100, 400);

        // Let's add some colours
        cube.GetComponent<MeshRenderer>().material.color = Random.ColorHSV(0f, 1f, 1f, 1f, 0.5f, 1f);


        Vector3 scale = new Vector3(Scale_x, Scale_y, Scale_z);

        cube.transform.localScale = scale;
    }

}
This is the result, less boring and easier to look at.
Now, let’s add more customization to the graph, allowing the user to modify the size of the graph using two buttons, so we create two buttons called “IncreaseSize” and “DecreaseSize” inside the panel.
Remember to anchor them, I personally use the top and centre anchor.
We need to modify our “GenDataViz.cs” script in order to these functionalities, so we add the two functions in order to decrease or increase the scale size of the graph, increasing ScaleSize the graph would become smaller, decreasing ScaleSize the graph would become bigger. Feel free to change the ScaleFactor at your will.
using System.Collections;
using System.Collections.Generic;
using UnityEngine;
using UnityEngine.UI; // Required when Using UI elements.

public class GenDataViz : MonoBehaviour
{
    int scaleSize = 100;
    int scaleSizeFactor = 10;
    public GameObject graphContainer;
    int binDistance = 13;
    float offset = 0;

    // Use this for initialization
    void Start()
    {
        CreateGraph();
    }


    public void ClearChilds(Transform parent)
    {
        offset = 0;
        foreach (Transform child in parent)
        {
            Destroy(child.gameObject);
        }
    }

    // Here we allow the use to increase and decrease the size of the data visualization
    public void DecreaseSize()
    {
        scaleSize += scaleSizeFactor;
        CreateGraph();
    }

    public void IncreaseSize()
    {
        scaleSize -= scaleSizeFactor;
        CreateGraph();
    }


    public void CreateGraph()
    {
        Debug.Log("creating the graph");
        ClearChilds(graphContainer.transform);
        for (var i = 0; i < LinearRegression.quantityValues.Count; i++)
        {
            createBin(10, (float)LinearRegression.quantityValues[i] / scaleSize, 10, offset, ((float)LinearRegression.quantityValues[i] / scaleSize) / 2, graphContainer);
            offset += binDistance;
        }

    }


    void createBin(float Scale_x, float Scale_y, float Scale_z, float Padding_x, float Padding_y, GameObject _parent)
    {
        GameObject cube = GameObject.CreatePrimitive(PrimitiveType.Cube);
        cube.transform.SetParent(_parent.transform, true);

        cube.transform.position = new Vector3(Padding_x, Padding_y - 100, 400);

        // Let's add some colours
        cube.GetComponent<MeshRenderer>().material.color = Random.ColorHSV(0f, 1f, 1f, 1f, 0.5f, 1f);


        Vector3 scale = new Vector3(Scale_x, Scale_y, Scale_z);

        cube.transform.localScale = scale;
    }

}
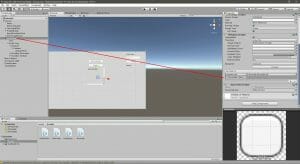
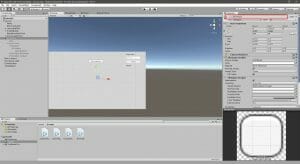
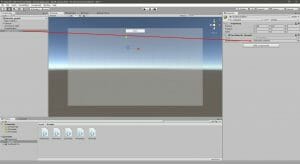
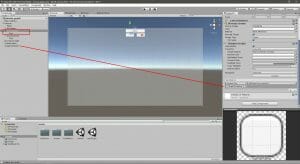
Assign the increase size function:
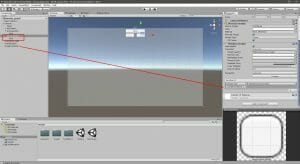
Assign the decrease size function:
Now, if everything works correctly, the increase button should make the graph bigger and the other should decrease the size.
Et voila, now when the user changes the scale size input, the graph should be recreated.
Let’s add a reset function, so if the user gets lost in increasing or decreasing the size of the graph, the user can reset the size easily with a button. Then, we create a new button called “ResetSize” inside the canvas. Anchor this button to the top center.
Let’s add a function inside “GenDataViz.cs”, here we add the “ResetSize” function that simply reset the ScaleSize value and recreate the graph calling the “CreateGraph” function.
using System.Collections;
using System.Collections.Generic;
using UnityEngine;
using UnityEngine.UI; // Required when Using UI elements.

public class GenDataViz : MonoBehaviour
{
    int scaleSize = 100;
    int scaleSizeFactor = 10;
    public GameObject graphContainer;
    int binDistance = 13;
    float offset = 0;

    // Use this for initialization
    void Start()
    {
        CreateGraph();
    }


    public void ClearChilds(Transform parent)
    {
        offset = 0;
        foreach (Transform child in parent)
        {
            Destroy(child.gameObject);
        }
    }

    // Here we allow the use to increase and decrease the size of the data visualization
    public void DecreaseSize()
    {
        scaleSize += scaleSizeFactor;
        CreateGraph();
    }

    public void IncreaseSize()
    {
        scaleSize -= scaleSizeFactor;
        CreateGraph();
    }

    //Reset the size of the graph
    public void ResetSize()
    {
        scaleSize = 100;
        CreateGraph();
    }


    public void CreateGraph()
    {
        Debug.Log("creating the graph");
        ClearChilds(graphContainer.transform);
        for (var i = 0; i < LinearRegression.quantityValues.Count; i++)
        {
            createBin(10, (float)LinearRegression.quantityValues[i] / scaleSize, 10, offset, ((float)LinearRegression.quantityValues[i] / scaleSize) / 2, graphContainer);
            offset += binDistance;
        }

    }


    void createBin(float Scale_x, float Scale_y, float Scale_z, float Padding_x, float Padding_y, GameObject _parent)
    {
        GameObject cube = GameObject.CreatePrimitive(PrimitiveType.Cube);
        cube.transform.SetParent(_parent.transform, true);

        cube.transform.position = new Vector3(Padding_x, Padding_y - 100, 400);

        // Let's add some colours
        cube.GetComponent<MeshRenderer>().material.color = Random.ColorHSV(0f, 1f, 1f, 1f, 0.5f, 1f);


        Vector3 scale = new Vector3(Scale_x, Scale_y, Scale_z);

        cube.transform.localScale = scale;
    }

}
Now, something is still missing, it’s the bar of the prediction about how many patients the hospital will need to take care in a future year. We will add the prediction as a new a bar at the end of the histogram.
First, Let’s modify the “LinearRegression.cs” script, so we can call the “PredictionTask” function from the “graph_tutorial” scene and give the user the ability to generate different predictions from the new scene.
using System;
using System.Collections;
using System.Collections.Generic;
using UnityEngine;
using UnityEngine.UI;
using TMPro;

public class LinearRegression : MonoBehaviour
{
    public TextMeshProUGUI textPredictionResult;
    public TextMeshProUGUI textDatasetObject;
    public InputField inputObject;
    // Share the prediction with other scripts
    public static int PredictionOutput;

    // Use public and static to share the lists data
    public static List<double> yearValues = new List<double>();
    public static List<double> quantityValues = new List<double>();

    void Start()
    {
        // Clear the lists
        yearValues.Clear();
        quantityValues.Clear();

        TextAsset csvdata = Resources.Load<TextAsset>("dataset");

        string[] data = csvdata.text.Split(new char[] { '\n' });
        textDatasetObject.text = "Year Quantity";


        for (int i = 1; i < data.Length - 1; i++)
        {
            string[] row = data[i].Split(new char[] { ',' });

            if (row[1] != "")
            {
                DataInterface item = new DataInterface();

                int.TryParse(row[0], out item.year);
                int.TryParse(row[1], out item.quantity);

                yearValues.Add(item.year);
                quantityValues.Add(item.quantity);
                textDatasetObject.text += "\n" + item.year + " " + item.quantity;


            }
        }
    }

    public void PredictionTask()
    {

        double intercept, slope;
        LinearRegressionCalc(yearValues.ToArray(), quantityValues.ToArray(), out intercept, out slope);

        // We use the the static variable in order to share the result of the prediction
        // we convert to an int because we are talking about a number of patients
        PredictionOutput = (int)((slope * int.Parse(inputObject.text)) + intercept);
        textPredictionResult.text = "Result: " + PredictionOutput;
        Debug.Log("Prediction for " + inputObject.text + " : " + PredictionOutput);

    }


    public static void LinearRegressionCalc(
        double[] xValues,
        double[] yValues,
        out double yIntercept,
        out double slope)
    {
        if (xValues.Length != yValues.Length)
        {
            throw new Exception("Input values should be with the same length.");
        }

        double xSum = 0;
        double ySum = 0;
        double xSumSquared = 0;
        double ySumSquared = 0;
        double codeviatesSum = 0;

        for (var i = 0; i < xValues.Length; i++)
        {
            var x = xValues[i];
            var y = yValues[i];
            codeviatesSum += x * y;
            xSum += x;
            ySum += y;
            xSumSquared += x * x;
            ySumSquared += y * y;
        }

        var count = xValues.Length;
        var xSS = xSumSquared - ((xSum * xSum) / count);
        var ySS = ySumSquared - ((ySum * ySum) / count);

        var numeratorR = (count * codeviatesSum) - (xSum * ySum);
        var denomR = (count * xSumSquared - (xSum * xSum)) * (count * ySumSquared - (ySum * ySum));
        var coS = codeviatesSum - ((xSum * ySum) / count);

        var xMean = xSum / count;
        var yMean = ySum / count;

        yIntercept = yMean - ((coS / xSS) * xMean);
        slope = coS / xSS;
    }

}
As you can see we added a new static variable, “PredictedOutput” and modified the “PredictionTask” function, so this function can take a value from an input field and output the value in the “PredictedOutput” variable.
We convert the prediction result to an int because we are predicting the number of patients so a float number would not be appropriate, we can’t have one patient and a half! 🙂
Now, let’s modify the “GenDataViz.cs”
using System.Collections;
using System.Collections.Generic;
using UnityEngine;
using UnityEngine.UI; // Required when Using UI elements.

public class GenDataViz : MonoBehaviour
{
    int scaleSize = 100;
    int scaleSizeFactor = 10;
    public GameObject graphContainer;
    int binDistance = 13;
    float offset = 0;

    // Use this for initialization
    void Start()
    {
        CreateGraph();
    }


    public void ClearChilds(Transform parent)
    {
        offset = 0;
        foreach (Transform child in parent)
        {
            Destroy(child.gameObject);
        }
    }

    // Here we allow the use to increase and decrease the size of the data visualization
    public void DecreaseSize()
    {
        scaleSize += scaleSizeFactor;
        CreateGraph();
    }

    public void IncreaseSize()
    {
        scaleSize -= scaleSizeFactor;
        CreateGraph();
    }

    //Reset the size of the graph
    public void ResetSize()
    {
        scaleSize = 100;
        CreateGraph();
    }


    public void CreateGraph()
    {
        Debug.Log("creating the graph");
        ClearChilds(graphContainer.transform);
        for (var i = 0; i < LinearRegression.quantityValues.Count; i++)
        {
            createBin(10, (float)LinearRegression.quantityValues[i] / scaleSize, 10, offset, ((float)LinearRegression.quantityValues[i] / scaleSize) / 2, graphContainer);
            offset += binDistance;
        }
        // Let's add the predictio as the last bar, only if the user made a prediction
        if (LinearRegression.PredictionOutput != 0)
        {
            createBin(10, (float)LinearRegression.PredictionOutput / scaleSize, 10, offset, ((float)LinearRegression.PredictionOutput / scaleSize) / 2, graphContainer);
            offset += binDistance;
        }

    }


    void createBin(float Scale_x, float Scale_y, float Scale_z, float Padding_x, float Padding_y, GameObject _parent)
    {
        GameObject cube = GameObject.CreatePrimitive(PrimitiveType.Cube);
        cube.transform.SetParent(_parent.transform, true);

        cube.transform.position = new Vector3(Padding_x, Padding_y - 100, 400);

        // Let's add some colours
        cube.GetComponent<MeshRenderer>().material.color = Random.ColorHSV(0f, 1f, 1f, 1f, 0.5f, 1f);


        Vector3 scale = new Vector3(Scale_x, Scale_y, Scale_z);

        cube.transform.localScale = scale;
    }

}
We added the prediction as the last bar of the histogram, but only if the user made a prediction in the previous scene, otherwise the graph will visualize the dataset without the prediction bar.
Let’s add a UI TextMeshPro for the year of the predictions, inside the “tutorial_graph” scene, called “PredictionLabel“.
Now, let’s modify our “LinearRegression.cs” script in order to share the year of the prediction.
using System;
using System.Collections;
using System.Collections.Generic;
using UnityEngine;
using UnityEngine.UI;
using TMPro;

public class LinearRegression : MonoBehaviour
{
    public TextMeshProUGUI textPredictionResult;
    public TextMeshProUGUI textDatasetObject;
    public InputField inputObject;
    // Share the prediction with other scripts
    public static int PredictionOutput;

    //Share the prediction year with other scripts
    public static int PredictionYear;

    // Use public and static to share the lists data
    public static List<double> yearValues = new List<double>();
    public static List<double> quantityValues = new List<double>();

    void Start()
    {
        // Clear the lists
        yearValues.Clear();
        quantityValues.Clear();

        TextAsset csvdata = Resources.Load<TextAsset>("dataset");

        string[] data = csvdata.text.Split(new char[] { '\n' });
        textDatasetObject.text = "Year Quantity";


        for (int i = 1; i < data.Length - 1; i++)
        {
            string[] row = data[i].Split(new char[] { ',' });

            if (row[1] != "")
            {
                DataInterface item = new DataInterface();

                int.TryParse(row[0], out item.year);
                int.TryParse(row[1], out item.quantity);

                yearValues.Add(item.year);
                quantityValues.Add(item.quantity);
                textDatasetObject.text += "\n" + item.year + " " + item.quantity;


            }
        }
    }

    public void PredictionTask()
    {

        double intercept, slope;
        LinearRegressionCalc(yearValues.ToArray(), quantityValues.ToArray(), out intercept, out slope);

        // We use the the static variable in order to share the result of the prediction
        // we convert to an int because we are talking about a number of patients
        PredictionOutput = (int)((slope * int.Parse(inputObject.text)) + intercept);

        // assign the prediction year
        PredictionYear = int.Parse(inputObject.text);

        textPredictionResult.text = "Result: " + PredictionOutput;
        Debug.Log("Prediction for " + inputObject.text + " : " + PredictionOutput);

    }


    public static void LinearRegressionCalc(
        double[] xValues,
        double[] yValues,
        out double yIntercept,
        out double slope)
    {
        if (xValues.Length != yValues.Length)
        {
            throw new Exception("Input values should be with the same length.");
        }

        double xSum = 0;
        double ySum = 0;
        double xSumSquared = 0;
        double ySumSquared = 0;
        double codeviatesSum = 0;

        for (var i = 0; i < xValues.Length; i++)
        {
            var x = xValues[i];
            var y = yValues[i];
            codeviatesSum += x * y;
            xSum += x;
            ySum += y;
            xSumSquared += x * x;
            ySumSquared += y * y;
        }

        var count = xValues.Length;
        var xSS = xSumSquared - ((xSum * xSum) / count);
        var ySS = ySumSquared - ((ySum * ySum) / count);

        var numeratorR = (count * codeviatesSum) - (xSum * ySum);
        var denomR = (count * xSumSquared - (xSum * xSum)) * (count * ySumSquared - (ySum * ySum));
        var coS = codeviatesSum - ((xSum * ySum) / count);

        var xMean = xSum / count;
        var yMean = ySum / count;

        yIntercept = yMean - ((coS / xSS) * xMean);
        slope = coS / xSS;
    }

}
Now, we take the prediction year inside the “GenDataViz.cs” scripts and we will show the text inside the TextMeshPro element.
using System.Collections;
using System.Collections.Generic;
using UnityEngine;
using UnityEngine.UI; // Required when Using UI elements.
using TMPro; // required to use text mesh pro elements

public class GenDataViz : MonoBehaviour
{
    int scaleSize = 100;
    int scaleSizeFactor = 10;
    public GameObject graphContainer;
    int binDistance = 13;
    float offset = 0;

    //Add a label for the prediction year
    public TextMeshProUGUI textPredictionYear;


    // Use this for initialization
    void Start()
    {
        CreateGraph();
    }


    public void ClearChilds(Transform parent)
    {
        offset = 0;
        foreach (Transform child in parent)
        {
            Destroy(child.gameObject);
        }
    }

    // Here we allow the use to increase and decrease the size of the data visualization
    public void DecreaseSize()
    {
        scaleSize += scaleSizeFactor;
        CreateGraph();
    }

    public void IncreaseSize()
    {
        scaleSize -= scaleSizeFactor;
        CreateGraph();
    }

    //Reset the size of the graph
    public void ResetSize()
    {
        scaleSize = 100;
        CreateGraph();
    }


    public void CreateGraph()
    {
        Debug.Log("creating the graph");
        ClearChilds(graphContainer.transform);
        for (var i = 0; i < LinearRegression.quantityValues.Count; i++)
        {
            createBin(10, (int)LinearRegression.quantityValues[i] / scaleSize, 10, offset, ((int)LinearRegression.quantityValues[i] / scaleSize) / 2, graphContainer);
            offset += binDistance;
        }
        Debug.Log("creating the graph: " + LinearRegression.PredictionOutput);

        // Let's add the predictio as the last bar, only if the user made a prediction
        if (LinearRegression.PredictionOutput != 0)
        {
            createBin(10, LinearRegression.PredictionOutput / scaleSize, 10, offset, (LinearRegression.PredictionOutput / scaleSize) / 2, graphContainer);
            offset += binDistance;
            textPredictionYear.text = "Prediction of " + LinearRegression.PredictionYear;
        }
        else
        {
            textPredictionYear.text = " ";

        }
    }


    void createBin(float Scale_x, float Scale_y, float Scale_z, float Padding_x, float Padding_y, GameObject _parent)
    {
        GameObject cube = GameObject.CreatePrimitive(PrimitiveType.Cube);
        cube.transform.SetParent(_parent.transform, true);

        cube.transform.position = new Vector3(Padding_x, Padding_y - 100, 400);

        // Let's add some colours
        cube.GetComponent<MeshRenderer>().material.color = Random.ColorHSV(0f, 1f, 1f, 1f, 0.5f, 1f);


        Vector3 scale = new Vector3(Scale_x, Scale_y, Scale_z);

        cube.transform.localScale = scale;
    }

}
We assign the prediction label to the script.
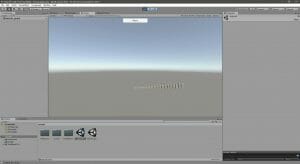
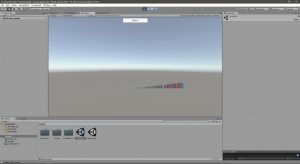
Finally, our data visualization should look like this:
That’s all for this second part of the tutorial, I hope you have enjoyed it!
In the next and last part, we’ll write the code to visualize our 3D data visualization in Augmented Reality using EasyAR. In the meantime, have fun with our project, trying to customize the 3D data visualization and the UI as you prefer! 🙂
See you soon!
